
2024 Energy Intensity Performance
As outlined in the 2023 Energy Strategy Master Plan, SAWS has committed to decreasing the energy intensity of its operations by 10 percent by 2028. The plan provides recommendations on potential projects and process modifications for SAWS to consider in order to achieve this goal.
The first step in reducing energy intensity is to pursue low-cost and no-cost energy conservation measures identified within SAWS’ water and wastewater systems. District cooling on the other hand is in the process of implementing capital retrofit projects. In 2024, these measures provided significant energy savings for the wastewater and district cooling systems, reducing energy intensity by 8.0 percent and 5.7 percent respectively.
Energy intensity of water operations increased by 10.2 percent in 2024 from the baseline energy intensity in 2021-2022. The year was challenging due to persistent drought conditions which triggered the Edwards Aquifer pumping restrictions. This caused SAWS to rely on energy intensive water sources to meet customer demand.
Additionally, the Edwards Aquifer level dropped from 648 feet to 626 feet causing the water to be pumped a longer distance to reach the surface, using more energy.
| OPERATION | EI METRIC | EI BASELINE | 2024 EI | PERCENTAGE CHANGE |
| WATER | KWH / MG | 3,502 | 3,932 | 12.2% |
| WASTEWATER | KWH / FLOW MG | 1,762 | 1,620 | -8.0% |
| DISTRICT COOLING |
KWH / 1000 TON-HRS | 1,022 | 964 | -5.7% |
| BUILDINGS | KWH / SQUARE FT. | 14 | 14 | -0% |
| TOTAL | 2,893 | 3,188 | 10.2 |
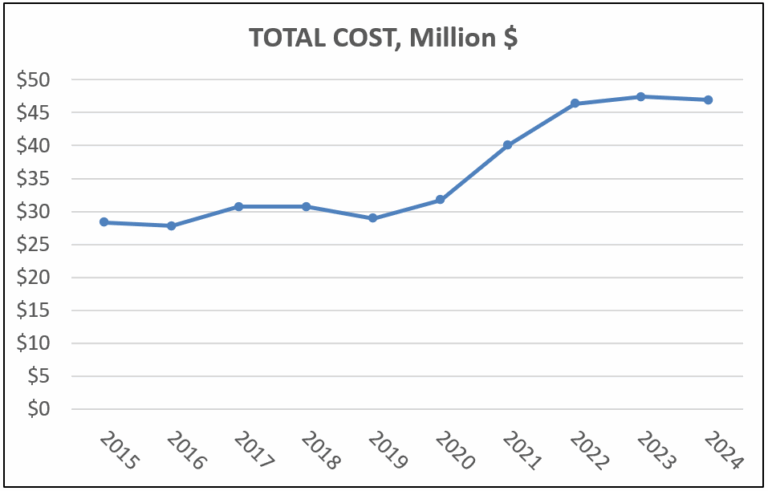
Costs by Year 2015-2024
From 2015 to 2024, utility costs increased 65 percent overall or 5.2 percent compounded annually. Of this annual growth rate, 4.8 percentage point growth was related to consumption increases, while price increases attributed to the remaining 0.4 percent point growth.
Costs were relatively stable until 2020 when the Vista Ridge water supply project came online. This project utilizes non-Edwards Aquifer water sources requiring more energy to deliver water from the Carrizo/Simboro Aquifer in Burleson County.
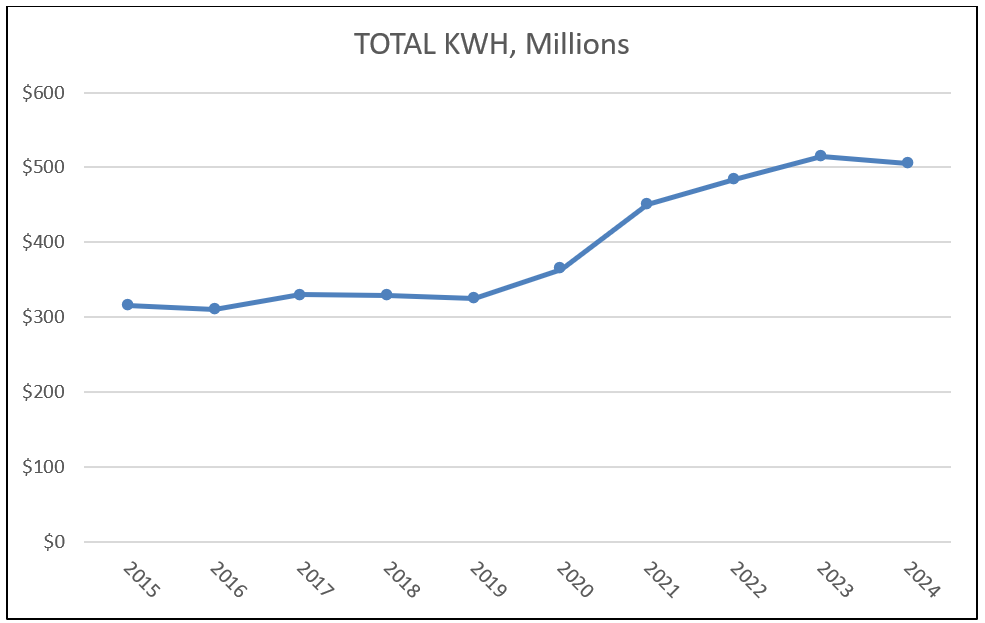
kWh by Year 2015-2024
Kilowatt hours increased 60 percent from 2015 to 2024, or 4.8 percent compounded annually. Increases were relatively flat until 2020 when additional water supplies from the Vista Ridge project came online. In 2022 through 2024, kilowatt hours (kWh) increased due to extreme temperatures and lower than average annual rainfall (64 percent, 38 percent, and 28 percent respectively). This weather caused more water to be pumped from more energy intensive water sources to meet customer demand, thus increasing electric consumption.
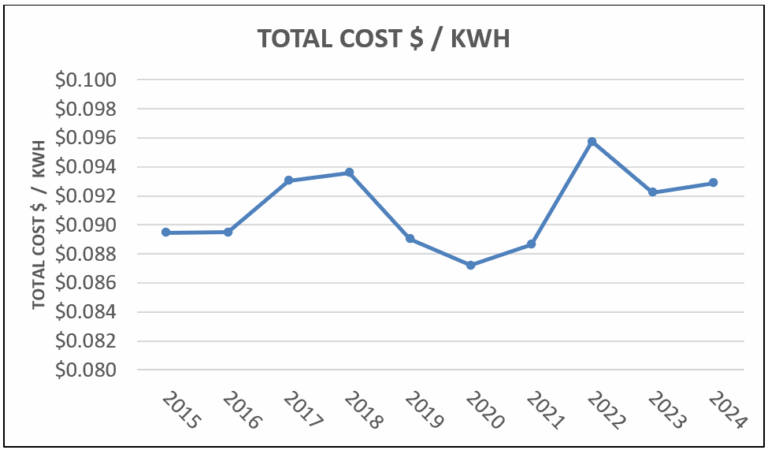
Cost per kWh 2015-2024
SAWS’ total energy costs have risen through the years, and it is expected that SAWS’ four electrical providers will have rate increases in the near future. The metric used to track energy costs is $/kWh. Essentially, this is the blended cost SAWS pays for a single unit of energy. One of the biggest influences on costs per kWh are fuel adjustment and regulatory charges which can impact the cost per kwh as shown in the chart below:
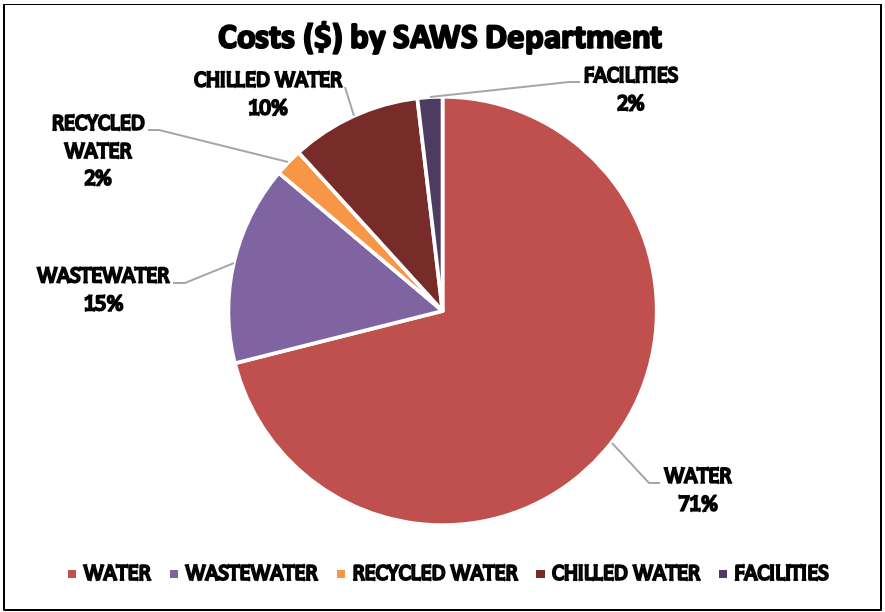
2024 Costs by SAWS Department
Water production makes up over 71 percent of utility costs at SAWS. Wastewater and Chilled water comprise most of the remaining 28 percent as illustrated in the chart below:
2024 Costs by Utility Provider
SAWS receives its electricity from four different electrical providers. CPS Energy is the largest provider at 78 percent of total costs. Guadalupe Valley Electrical Cooperative, Bluebonnet Electrical Cooperative Utility and New Braunfels Utilities make up the remaining 22 percent. The annual cost breakdown of the four utilities is shown below:
| UTILITY PROVIDER | PERCENT OF TOTAL |
TOTAL COST $ |
| CPS | 77.8 | $36,508,644 |
| GVEC | 7.4 | $3,455,035 |
| BLUEBONNET | 14.8 | $6,961,676 |
| NEW BRAUNFELS UTILITY | 0.003 | $1,234 |
| TOTAL | 100 | $46,926,589 |
Energy Use by Water Source 2024
SAWS has a diverse water portfolio, including sources outside of San Antonio’s extraterritorial jurisdiction. SAWS’ oldest and main water source remains the Edwards Aquifer which still accounts for 60 percent of SAWS’ total water production. The below represents annual energy consumption by water source:
| WATER SOURCE | TOTAL (kWh) | PERCENT OF TOTAL |
| EDWARDS | 147,215,423 | 42.7 |
| VISTA RIDGE | 130,732,491 | 37.9 |
| ASR PRODUCTION | 30,245,541 | 8.8 |
| DESALINATION | 23,916,427 | 6.9 |
| REGIONAL CARRIZO | 4,852,105 | 1.4 |
| LOCAL CARRIZO | 4,428,608 | 1.3 |
| TRINITY | 3,480,084 | 1.0 |
| TOTAL | 344,870,679 | 100 |
kWh– Kilowatt-hour: measured as 1 kilowatt (1,000 watts) of power expended for 1 hour.